Top Charts: the daily top 100 on the App Store and Google Play
The top free, paid and grossing apps on the App Store and Google Play, by country and category, refreshed daily with each app's movement since yesterday.
Video transcript
Top Charts is the daily ranking of the top free, paid and grossing apps, per store, country and category. Filter by store, collection, category and country. Titles show in the storefront's own language. Each row gives the rank, the app, its developer, its rating, and its move since yesterday. A number is a climb or a slip. New marks an app that just entered the chart. The side rail sums up the day: the biggest movers, the new entries, and the apps that dropped out, usually the interesting list. Signed in, the chart goes as deep as the store publishes it, and Unlimited exports it to CSV. Read it right: a chart place counts installs. Your keyword positions say whether anyone finds you. If your keywords slid across the board, check the algorithm change detector first. Read your own category, not the overall chart. That's where an app your size can appear. And an app falling fast has usually changed something: that's a competitor worth tracking. Charts also feed your visibility score, and the public page is free for anyone.
Top Charts is the daily ranking of the top free, top paid and top grossing apps on the App Store and Google Play, per country and per category, with each app's movement since the previous day. It is free and public at applyra.io/tools/top-charts, and the same data sits inside the app under Top Charts in the Tools group of the sidebar.
Charts are the part of store visibility you do not choose. They also feed your visibility score, which is why they live here rather than in a separate product.
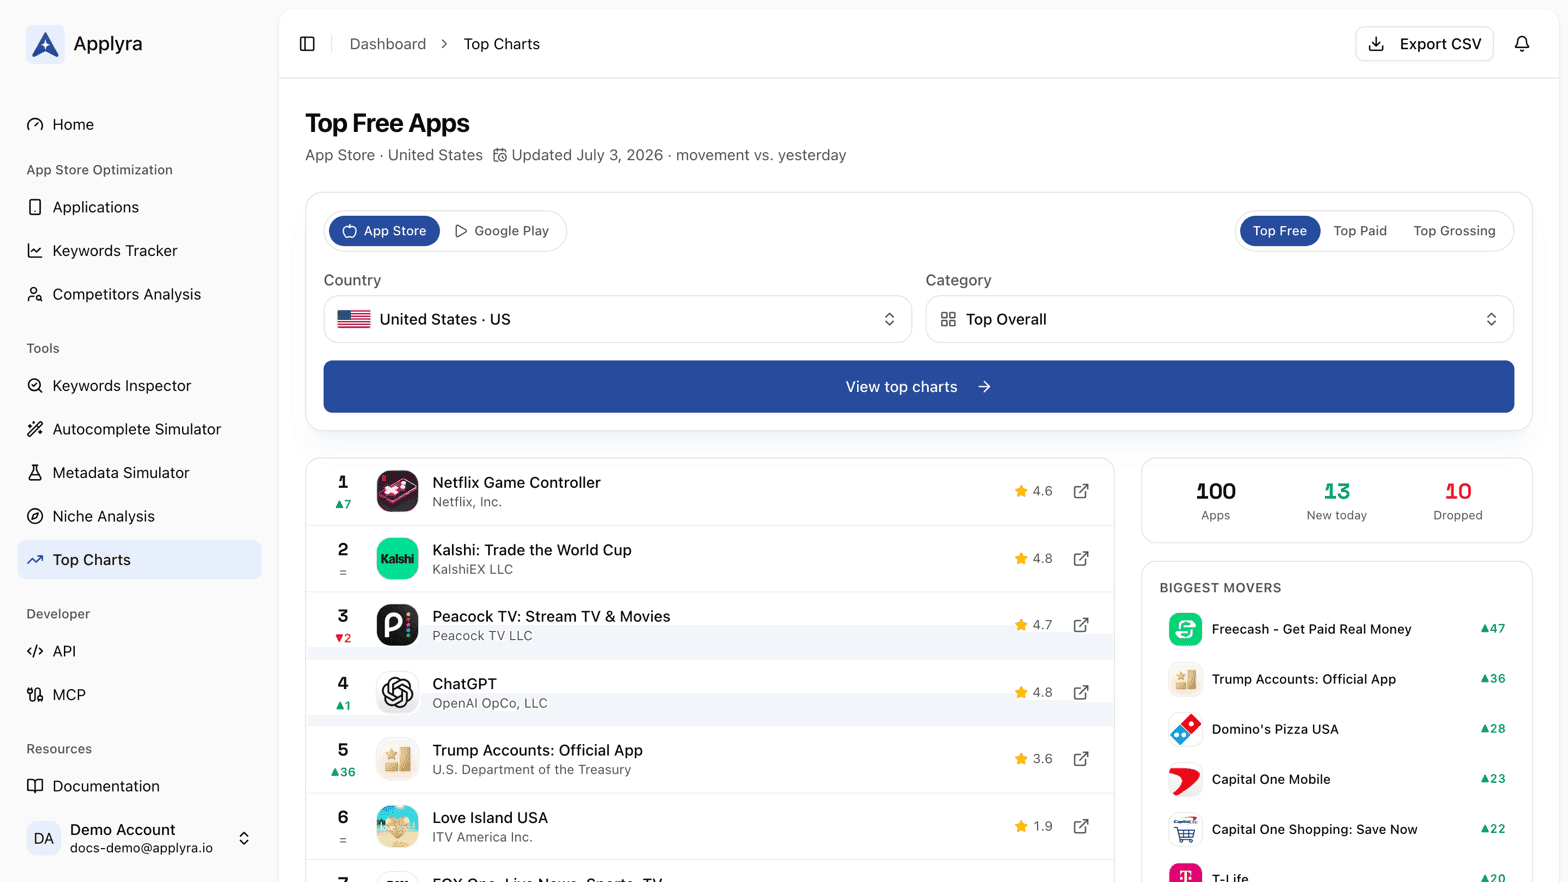
What you can filter: store, collection, category, country
| Dimension | Values |
|---|---|
| Store | App Store, Google Play |
| Collection | Top free, top paid, top grossing |
| Category | The overall chart, plus every category each store publishes a chart for |
| Country | Every storefront Applyra supports: 116 on the App Store, 117 on Google Play |
Titles are shown in the language of the storefront you are looking at, because that is what users of that market see. Markets and how Applyra treats them are covered in markets.
What each row tells you
Rank, icon, app name, developer, rating and price, plus the movement against the previous day's snapshot. Three states are worth watching:
- A delta, positive when the app climbed and negative when it slipped.
- New, for an app that was not on the chart yesterday and is today.
- Dropped out, listed separately, for an app that was on the chart yesterday and is gone. That list is usually the more interesting one.
Public chart pages list the top 100. Signed in, the chart goes as deep as the store publishes it, next to a rail with the biggest movers, the new entries and the ones that fell out. CSV export of the visible chart is part of the Unlimited plan, alongside everything else in plans and limits.
Reading a chart without fooling yourself
A top chart is a leaderboard, not a market study. Three habits make it useful anyway.
Separate a chart move from a search move. A chart position answers "how many people installed this", and your keyword positions answer "can anyone find it". They move for different reasons and on different days. If your own rankings slid across the board rather than your chart place, start at the algorithm change detector.
Read the category chart, not the overall one. The overall chart in a large market is the same thirty companies every day. The chart of your own category is where an app your size can appear, and where the apps you actually compete with sit. Reading the same category in a country you do not sell in yet is where launching an app in a new market starts.
Use the dropouts as a source of competitors. An app that fell twenty places in a week has usually changed something, and the finder that turns that into a tracked rival is in finding competitors.
Getting it into your own tools
GET /api/v1/top-charts returns a chart for a given store, country, category and collection,
and GET /api/v1/top-charts/categories lists the categories available per store. Both are in
the API endpoints, and the same two are exposed as MCP tools in
MCP tools, so an assistant can read a chart without you opening a page.
If you track an app rather than only reading charts, its own chart positions already feed its score every day. That path starts at tracking an app.
Frequently asked questions
How often are the App Store and Google Play top charts updated?
Every day. Each chart page shows the latest daily ranking and how far each app moved against the previous day, including the apps that entered the chart and the ones that fell out of it.
Which charts, countries and categories are covered?
Top free, top paid and top grossing, for the overall chart and every category each store publishes one for, in every storefront Applyra supports: 116 on the App Store and 117 on Google Play.
Do I need an account to read the top charts?
No. The public charts at applyra.io/tools/top-charts are free and need no account. Signing in takes the chart as deep as the store publishes it, and adds the movers rail and CSV export.
Last updated on